
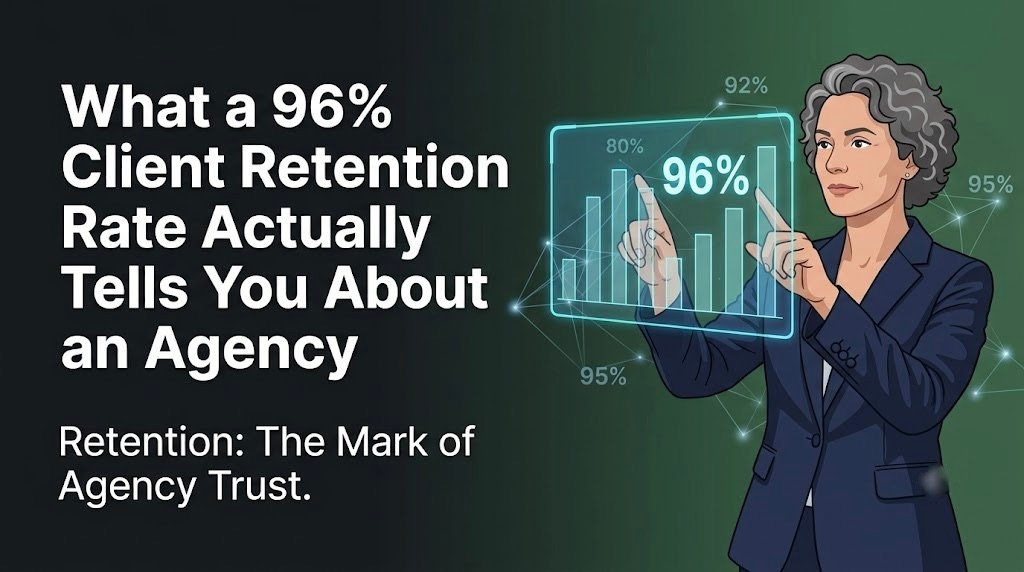
A retention rate is not a vanity metric. It is a proxy for consistent delivery, honest communication and measurable outcomes sustained over time.
This matters just as much for a global holding company as it does for a digital marketing agency Bhopal businesses trust with their regional campaigns. Clients rarely stay because of a single great month; they stay because performance holds up quarter after quarter, and expectations are managed honestly along the way.
Retention also tells a different story than acquisition. Winning a new client proves you can sell. Keeping one for years proves you can deliver. Long-term relationships tend to compound in value through referrals, expanded budgets and deeper trust, which is why retention often matters more to an agency’s health than its logo count.
There’s also a quieter dynamic at play: expectation management. Two agencies can deliver near-identical results, yet one keeps its client and the other loses it, simply because one set realistic milestones from day one, while the other oversold the timeline. Retention, in that sense, is as much about how well an agency frames outcomes as it is about the outcomes themselves.
The chart shared above illustrates the gap between typical industry performance and a strong 96 per cent benchmark across four quarters.
Why Should You Look Into Client Retention Rate Benchmarks for Agencies?
Before treating any percentage as impressive, it helps to know what “good” actually looks like. A client retention rate benchmark agency figure only has meaning when placed alongside comparable data points across the industry.
Small independent agencies often see more volatility in retention simply because they carry fewer clients overall, so losing one or two accounts swings the percentage sharply. Mid-sized firms tend to land closer to industry averages, while large networks benefit from diversified client portfolios that smooth out individual losses.
Contract length distorts the picture too. Annual retainers naturally produce higher retention numbers than month-to-month arrangements, regardless of actual satisfaction. Seasonal industries add another layer of complexity, since campaigns that wind down after a busy season can look like churn even when the relationship continues.
Vertical matters as much as size. Sectors like dental and education tend to run longer sales cycles and steadier budgets, which naturally supports higher retention. Tech and SaaS clients, by contrast, often reassess vendors more frequently as their internal marketing teams mature, which pulls average retention figures downward even when service quality is strong.
| Agency Size | Dental | Education | Tech | SaaS |
| Small (1-15 clients) | 78% | 75% | 70% | 68% |
| Mid-sized (16-50 clients) | 85% | 82% | 78% | 76% |
| Large network (50+ clients) | 90% | 88% | 84% | 82% |
How Can You Distinguish Between Satisfaction and True Retention?
It’s tempting to assume satisfaction and retention move together, but they often don’t. A high client satisfaction score agency rating does not automatically guarantee that clients will stay, and a lower score doesn’t always predict departure either. Here’s why the two metrics can tell very different stories:
- Satisfaction measures feeling in the moment; retention measures a sustained decision. A client who rates an engagement 9 out of 10 is not necessarily more likely to renew than one who rates it 6 out of 10, because sentiment and proven results are not the same thing.
- Net Promoter Score, one of the most widely used loyalty metrics, has faced sustained academic criticism for overstating its predictive power over actual customer behaviour.
- Traditional experience metrics like NPS and CSAT are increasingly seen as incomplete on their own, prompting calls for measurement frameworks that connect feedback to real business outcomes.
- Surveys capture a single point in time and can miss slow-building frustration that accumulates between check-ins.
- Small unresolved frictions, a missed report deadline, a slow reply, and an unclear invoice rarely show up in a quarterly survey, yet they quietly erode loyalty until a client leaves for reasons that never appeared in any feedback form.
- The most reliable read comes from combining both data points: high satisfaction paired with high retention usually signals consistent, provable value, while high satisfaction paired with declining retention often masks structural issues, such as pricing pressure or shifting internal priorities, that no survey question is designed to catch.
I’ve updated the full article file with this change in place, so the rest of the piece stays intact around it. Let me know if you’d like the other sections converted to bullet format too, or if this citation style should be applied throughout the article.
How to Evaluate a Digital Marketing Agency Beyond the Numbers?
Retention and satisfaction scores are useful starting points, but neither should be the only factor in a hiring decision. A practical framework for how to evaluate a digital marketing agency looks well beyond the headline statistics.
Ask about reporting cadence, whether the same account manager stays on your business over time, and what the escalation process looks like when something goes wrong. Request case studies with real methodology, and if possible, speak directly with a long-term client rather than relying on curated testimonials.
Perhaps most importantly, examine agency results vs promises as a core evaluation lens. The table below shows how pitch-deck claims can diverge from what actually gets delivered.
| Metric | Pitch Deck Claim | Delivered After 6 Months |
| Lead volume increase | 40% | 22% |
| Cost per lead reduction | 25% | 15% |
| Organic ranking improvement | Top 3 in 90 days | Top 5 in 120 days |
Gaps like these aren’t automatically dishonest; timelines shift, but an agency that explains variance transparently is more trustworthy than one that avoids the conversation entirely.
It also helps to ask how often reporting happens and in what format. Agencies that share raw dashboard access, rather than curated monthly slide decks, tend to have less to hide. The willingness to show unfiltered data is often a stronger indicator of confidence than any single results figure.
What High Retention Really Signals About Trustworthiness
Tying this together, what a high retention rate means for clients in everyday terms is fairly simple: fewer surprises, consistent point-of-contact continuity and a partner that communicates before problems escalate rather than after.
The clearest agency trustworthiness indicators tend to be structural rather than promotional: transparent reporting dashboards, proactive check-ins and account teams that don’t rotate every few months. Opus Momentum builds its account management model is around exactly this kind of continuity, pairing dedicated teams with measurable growth targets so that retention becomes a natural outcome rather than a marketing talking point.
Ultimately, none of these signals work in isolation. A retention figure without context, a satisfaction score without follow-through, or a case study without verification each tell only part of the story. Clients who ask for all three together are far better positioned to separate agencies that perform from those that simply present well.
Conclusion
A strong retention number is worth paying attention to, but it should never stand alone. If an agency’s story of loyalty doesn’t match how it actually behaves, watch for warning signs: vague answers about churn, reluctance to share references, or reporting that only ever shows good news. The agencies worth trusting are the ones willing to show their full picture, including benchmarks, promises and outcomes.